|
The Weekly Report For January 9th-13th
Commentary: The stock market kicked off 2012 with a gap higher, extending the rally that occurred in late December. While the markets gapped higher on Tuesday as traders returned from the holidays, they closed weakly and spent a couple of days digesting the gains. Friday saw the markets gapping higher again on a better than expected unemployment report which was faded right at the start. The markets did finish close to their highs for the week though, despite the lackluster intraday action. If the markets can quietly consolidate in this area, it could set the stage for a push higher in the coming weeks.
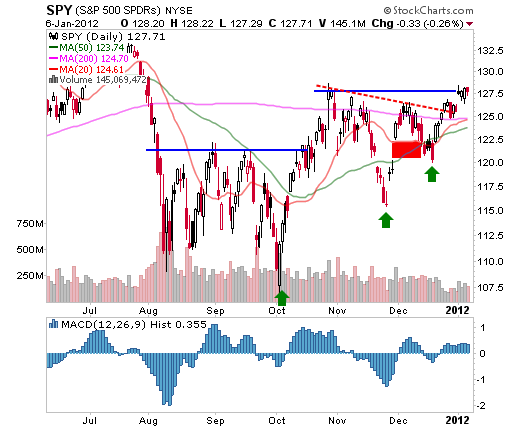
The S&P500 as represented by the S&P 500 SPDRS (NYSE:SPY) ETF is now testing a very important level. The $129 level is where the rally in October ended. After a few months of consolidation, SPY has finally come back to test this level for a breakout. SPY has been setting progressively higher lows as it follows its 50-day moving average higher. The price action for SPY has been positive over the past few weeks as it first reclaimed its 200-day moving average and then pushed higher. Setting and closing at a higher high ($129.42) would be a very positive development for SPY, and could signal an upcoming test of last years highs. (For related reading, see Day Trading Strategies For Beginners.)
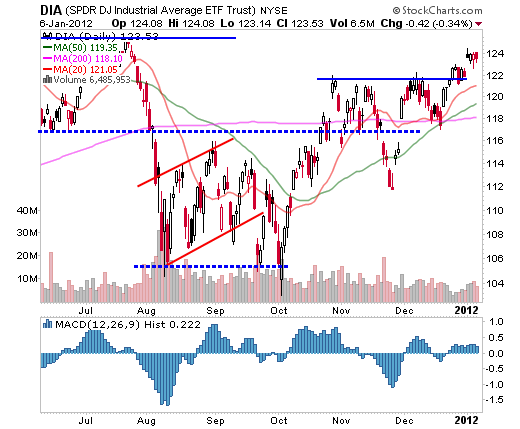
The DJ Industrial Average as represented by the Diamonds Trust, Series 1 (NYSE:DIA) ETF actually cleared its October highs already and could be acting as a leading indicator. While DIA is comprised of only 30 stocks and can be influenced by a move in only a few stocks, the fact that it is already close to last years highs is very positive. Traders should keep an eye on the $122 in case DIA pulls back as this level should attract buyers. However, if DIA continues to act well, it could challenge last years highs in short order.
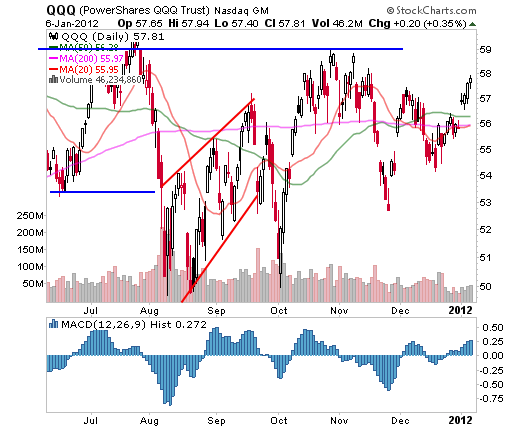
The Nasdaq 100 as represented the Powershares QQQ ETF (Nasdaq:QQQ) ETF actually had a very good start to the year. While it also suffered from a lackluster close after its gap on Tuesday, it had a decent follow through the rest of the week as it closed higher every single day. QQQ ended the week solidly in the green and cleared its December highs. It also failed to fill its open gap which was a nice display of strength. It is a positive sign that QQQ is resuming its role as a leader, and it is actually still pretty close to all time highs. If QQQ can continue to lead the way, it would bode well for the rest of the markets.
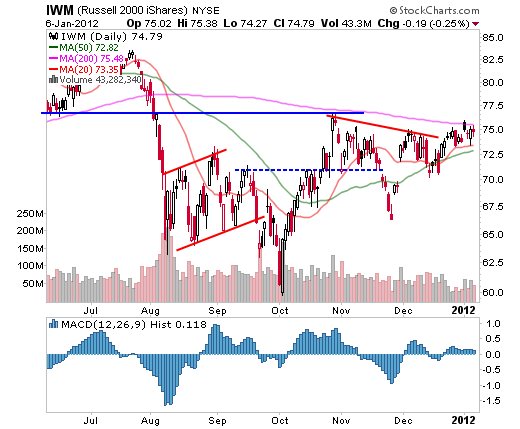
While the smallcaps as represented by the iShares Russell 2000 Index (NYSE:IWM) ETF didn’t fare as well as QQQ, the index ETF did finish higher for the week. IWM is still technically underperforming its peers, as it remains the only one of the four index ETF’s still below its 200-day moving average. Smallcaps typically outperform early in the year, so traders should keep a close eye on how they perform relative to the other index ETF’s. If the market is truly healthy, then this group should start gradually performing better than DIA and SPY at a minimum. This weeks highs are the first level to keep an eye on, as IWM failed to approach it after the gap on Tuesday. IF IWM can close above this level, it should set the stage for a push into the high $70’s.
While the markets didn’t exactly set the world on fire after the strong gap on Tuesday, there are a lot of positives to take away from this week’s price action. The markets did close higher for the first week of the year and QQQ performed very well. Technically, the markets are a little on the overbought side, so further consolidation would actually be healthier than a surge higher. However, they are not so overbought as to prevent a push higher and that remains a possibility. That being said, for several months this market has punished the chasing of a breakout or breakdown. Nothing occurred this week to call this pattern into question. The few gaps higher were faded, and the markets quietly consolidated. Traders need to remain cautious despite the positive action on the surface. (For related reading, see Mastering Short-Term Trading.)
Charts courtesy of stockcharts.com
Read, learn, discuss, and share all about trading at TradersLaboratory (TL), the leading online trading forum for day traders, swing traders, and active investors |