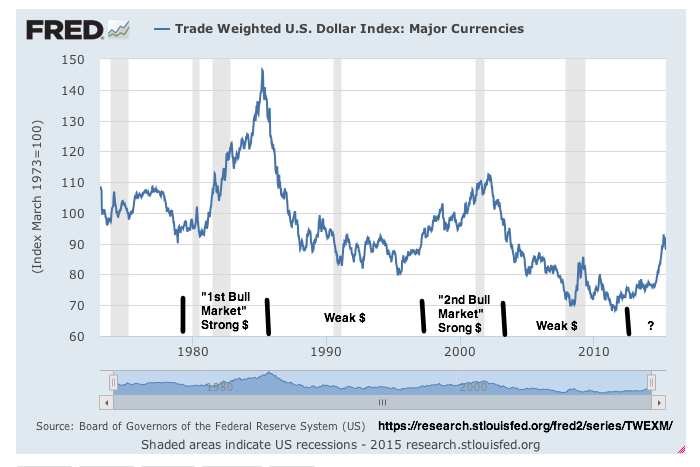
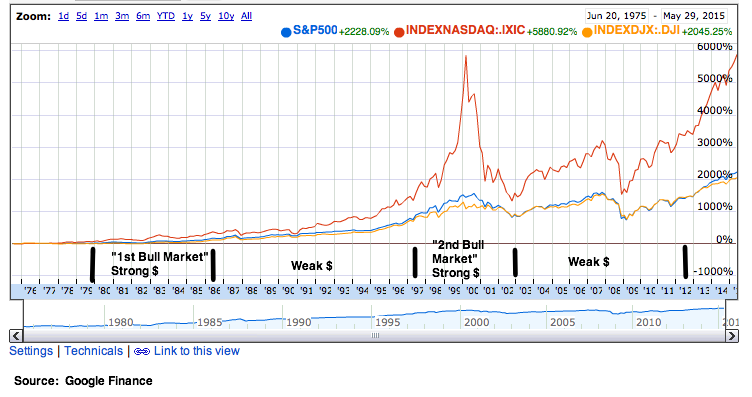
There has been an observation, in the Chinese media, that US Dollar Index (USDX) follows a 10-year weak dollar period followed by a 6-year strong dollar period, at least 2 such cycles have been seen (from early 70s – ’86, weak $, followed by ’86 -’92, strong $. And from ’87 – ’97, weak $, followed by ’97 – ’02, strong $. The 3rd cycle: ’02 – ’12, weak $, ’12 – ’18, strong $?). If this observation holds true for the third cycle, there is more fuel left in the current bull market has until 2018, that’s about 3 more years of bull market.
About admin
Richard Cheng, M.D., Ph.D., is an avid Wall Street investor with 20+ years of investing experience. He is specially adept at observing the world to find the patterns and then design strategies to win his battle. Most, if not all, happenings in the world, follow certain patterns. These patterns may be complex, multi-factorial, not so intuitive at the first glance, or even may appear chaotic. However, even chaos has its own patterns. If you pay attention and be patient, you'll find them and then you will gain an upper hand in your battle. Using this blog space, he documents his trades and his thoughts as they happen. He uses this blog as a a notebook to help him better refine his strategies. Hopefully this will help you as well. Good luck in your trading.